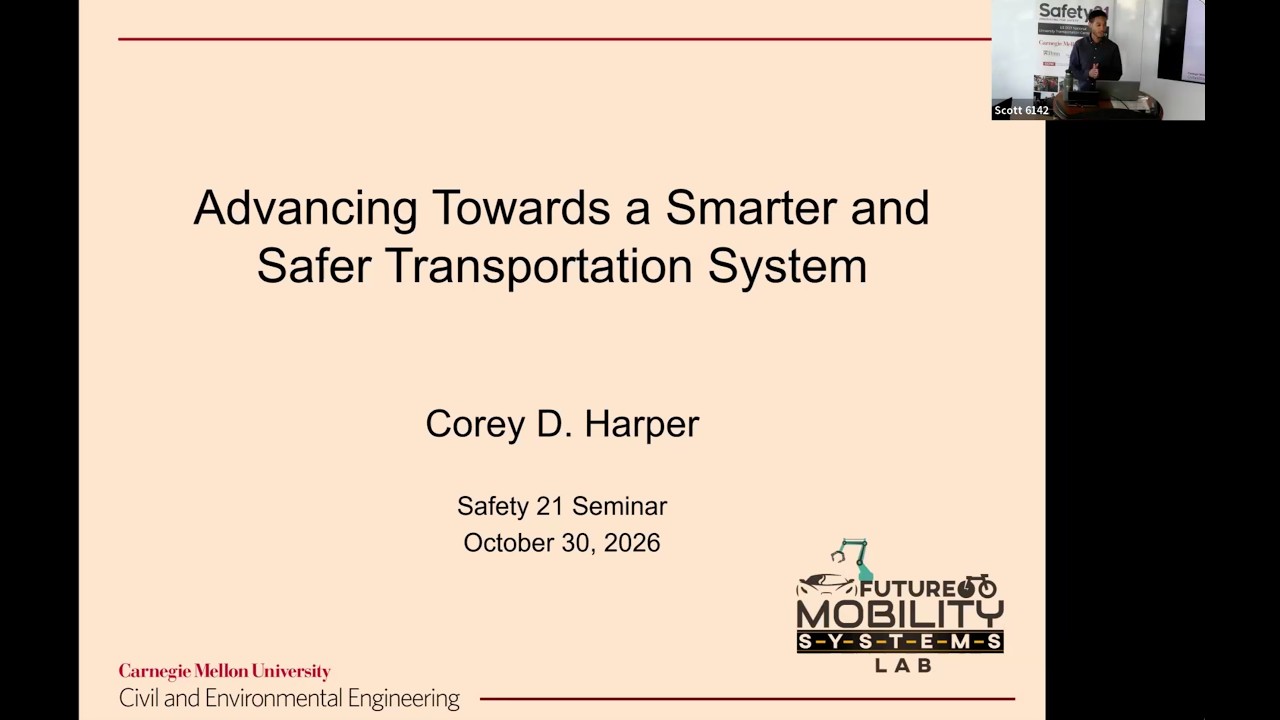
10.30.26 - Corey Harper
Title history
- 10.30.26 - Corey Harper — observed on 20261101-0213 UTC (YouTube)
Keywords
Summary
196 words
Critical Evaluation
Value of the Information & Strength of the Argument
The presentation provides substantial value by moving beyond aggregate analyses to scenario-specific crash factor identification. The use of latent class analysis to segment crashes into distinct profiles is methodologically sound and yields actionable insights. The argumentation is clear and well-supported with data visualizations and statistical results. The speaker effectively contrasts his approach with prior research, highlighting how average effects can mask important differences. He also discusses practical implications and acknowledges limitations, such as the need to explore time-of-day effects further. The logic flows logically from problem statement to methodology to results to policy recommendations.
Scientific Rigor, Source Quality, Title Accuracy
The talk is technically rigorous, relying on official crash databases (NHTSA Standing General Order, PennDOT). The published study in the Journal of Safety Research indicates peer-review quality. The citation of SAE levels and prior research shows awareness of the field. The title of the video is inadequate as it merely gives a scheduling code, not reflecting the substantive content. The talk would benefit from a descriptive title, but this does not affect the scientific content presented.
185 words
Title / Content Match
The title is a scheduling ID ('10.30.26 - Corey Harper') and does not reflect the content. The talk is a technical presentation on AV and EV crash analysis.
Quality & Reliability
9/10
The talk presents rigorous research based on official NHTSA Standing General Order crash data and PennDOT data, with transparent methodology (latent class analysis, SHAP, association rule mining) and published in a peer-reviewed journal. The speaker is an associate professor at Carnegie Mellon, adding credibility.
Key Moments
Markers derived by PSI from the transcript: the creator did not define chapters.
- Introduction to smart city components and research focus
- Discussion of road fatality trends and AV potential
- Explanation of the six levels of automation using emojis
- Overview of AV crash study methodology with NHTSA data
- Latent class analysis results for AV crashes: three scenarios
- SHAP interpretation results: factors like non-motorists and weather
- Policy recommendations for improving AV safety
- Introduction to EV crash study motivation and data
- EV latent class analysis: five crash scenarios
- Association rule mining results: high-lift rules such as motorcycle involvement
Cited Sources
- National Highway Traffic Safety Administration Standing General Order — Used as primary data source for AV crash analysis in California
- Journal of Safety Research publication on level 4 AV crashes — Study discussed in detail during the talk, presenting the latent class and SHAP analysis
- Society of Automotive Engineers (SAE) Levels of Automation — Referenced to explain automation levels, especially level 4 vs 5
- PennDOT statewide crash data — Data source for the ongoing electric vehicle crash analysis
Concurring Sources
- NHTSA Standing General Order reports — Official crash reports provided by manufacturers, consistent with the speaker's use.
- Existing literature on AV crash factors — Earlier studies have examined AV crashes but focused on average effects, aligning with the speaker's point.
Contribution & Novelties
The talk’s original contribution lies in using scenario segmentation (latent class analysis) and explainable AI (SHAP) to uncover heterogeneous crash factors for level 4 autonomous vehicles, rather than averaging across all crashes. This approach reveals that injury risks differ substantially by crash scenario, enabling targeted policy interventions. The ongoing EV study similarly applies latent class analysis and association rule mining to identify specific factor combinations, moving beyond average effects.
Pour aller plus loin :
- Latent class analysis — Statistical method used to identify unobserved subgroups in crash data.
- SHAP (Shapley additive explanations) — Explainable AI technique to interpret machine learning model predictions.
- Association rule learning — Method for discovering co-occurrence patterns, used in EV crash analysis.
116 words
Radar Profile
The radar profile shows consistently high scores across all dimensions, indicating a well-balanced and technically strong presentation. The highest score is in level of technical detail and information quantity, reflecting the methodological depth. The lowest (but still high) score is in global reliability, likely due to reliance on self-reports from manufacturers and the ongoing nature of EV research.